Parking and Multimodal Design
Size and lay out parking facilities and multimodal transfer points.
Section progress
0% of the workflow complete
Highway & Traffic Engineering · Geometric design, traffic analysis, pavement, intersections and roadway safety to AASHTO and MUTCD.
Deliverable: Parking layout with demand analysis and ADA-accessible stall count.
Minimum tables, figures and equations for Parking and Multimodal Design
Tables — at least 6
- Table — trial sections or sizes considered, with the capacity of each and the selection decision
- Table — final selected geometry for every element: dimensions, thickness, grade, spacing, elevation
- Table — slab, beam, column and shear wall schedule with governing demand
- Table — ultimate limit state check summary: demand, capacity, ratio, pass or fail, governing clause
- Table — serviceability check summary: deflection, crack width, settlement, freeboard or velocity against its limit
- Table — factors of safety achieved against the factor required, per failure mode
Figures — at least 4
- Figure — free body diagram of each isolated element, fully labelled with loads, reactions, dimensions and axes
- Figure — shear and moment (or pressure and velocity) diagrams for each force-carrying element
- Figure — dimensioned section or plan of each designed element
- Figure — capacity versus demand plot, interaction diagram, or rating curve as applicable
Equations — at least 8
- Equation — equilibrium equations written out for each free body (sum of forces and sum of moments, or continuity and energy)
- Equation — the internal force relations V(x) and M(x), or the momentum/thrust relation, used to compute each element's demand
- Equation — the resulting demand at the critical section of each element, with numeric substitution
- Equation — the capacity expression for each element type, shown with full numeric substitution and units
- Equation — the sizing criterion that sets the final dimension (for example required area, depth or diameter)
- Equation — each limit state check written as demand over capacity with numbers substituted
- Equation — the factor of safety calculation for each failure mode checked
- Equation — punching shear, drift and deflection checks with limits
Number every table and figure (Table 4.x, Figure 4.x), caption it, and refer to it by number in your text. Number displayed equations and show the substitution with units. These counts are minimums — add whatever else your design needs.
Engineering documentation standard — required in every Chapter 4 subsection
These rules are graded on every subsection. Work that misses them is capped on technical accuracy, exhibits, codes and communication, whatever the quality of the prose.
Code and standard references
- Every requirement, factor, coefficient, limit and allowable you apply cites the governing document AND the exact section, article or sub-article number — e.g. ACI 318-19 §22.5.5.1, AISC 360-22 Chapter J, Section J3.6, AASHTO LRFD 10th Ed. Article 3.6.1.2.2, ASCE 7-22 §12.8.1, ASTM D2487, state DOT manual section, local stormwater manual chapter.
- Give the edition or year of every document the first time it appears, then use a consistent short form.
- Where a code equation is used, quote the equation number (e.g. Eq. 22.5.5.1) next to your displayed equation.
- Where you depart from a code provision, state the clause you are departing from and the engineering justification.
- List every code, standard and manual actually used in a Codes and Standards table at the start of the subsection.
Citations for statements
- Every statement of fact, value taken from elsewhere, material property, soil parameter, rainfall depth, unit cost or published method carries an in-text citation (APA) to its source.
- Field and lab data cite the report, boring log, gauge, survey file or test number and its date.
- Manufacturer data cites the product literature and revision date; software results cite the program, version and model file name.
- Uncited assertions are treated as assumptions and must appear in the assumptions table with a justification.
- Every in-text citation resolves to a full entry in the reference list.
Step-by-step calculations
- Structure every calculation the same way: (1) objective, (2) governing code clause, (3) equation in symbolic form with the equation number, (4) definition of each symbol, (5) numerical substitution, (6) result with units, (7) comparison against the limit and the pass/fail statement.
- Show the substitution line — never jump from the formula to the answer.
- Number displayed equations sequentially (Eq. 4.1, 4.2, …) and refer to them by number in the text.
- State the load or flow combination governing each calculation by name.
- Carry consistent significant figures and round only at the reported result; state the rounding convention once.
- Present repetitive element checks in a calculation table with one row per element and the same column order throughout.
Free body diagrams and figures
- Draw a separate free body diagram for each isolated element — no combined sketches standing in for several members.
- Dimension every FBD: span, depth, thickness, cover, eccentricity, embedment, slope, pipe diameter, wall height — with the dimension lines and values shown.
- Label every force, pressure, reaction and moment with its symbol, magnitude and units, and show the sign convention and coordinate axes.
- Show supports and boundary conditions explicitly (pin, roller, fixed, elastic, buoyant, hydrostatic).
- Accompany each FBD with its shear, moment, thrust, pressure or hydraulic grade diagram at the same scale reference.
- Number and caption every figure (Figure 4.x) and refer to it by number in the narrative; add a scale or north arrow to plans.
Units and notation
- Every number in text, tables, figures and equations carries its unit — no bare numbers.
- Use one unit system throughout (US customary or SI); if both appear, give the converted value in parentheses consistently.
- Check dimensional homogeneity of each equation and say so — the units of both sides must match.
- Provide a nomenclature table defining every symbol with its unit.
Checking and verification
- Every calculation is checked by an independent route — hand check against software, alternative method, order-of-magnitude estimate, or a published worked example — and the check is shown, not just claimed.
- Report demand-to-capacity ratios and factors of safety against the required values, with the source clause for each required value.
- Include a verification/checking table: item, method of check, expected, obtained, difference, accept or revise.
- Sanity-check every result (magnitude, direction, plausibility) and state the conclusion.
- Record who checked the work and on what date; flag anything still unverified as an open item.
- State limitations and the range over which the result is valid.
How to complete this section
Do this next: Read the Parking and Multimodal Design lecture and the worked example so you know what "Parking layout with demand analysis and ADA-accessible stall count." has to contain.
Not sure how to start or how much depth is expected? Read the fully written model example for this deliverable first — it shows the structure, tables and level of justification your advisor grades against.
Transportation Design Office — what this workspace teaches
Geometric design, traffic analysis, pavement, intersections and roadway safety to AASHTO and MUTCD.
- AASHTO Green Book design controls: design speed, functional class, design vehicle
- Traffic data: AADT, DHV, K and D factors, truck percentage, growth projection
- Horizontal alignment: curve radius, superelevation, side friction, transitions
- Vertical alignment: grades, crest and sag curves, K-values
- Sight distance: stopping, decision, passing and intersection sight distance
- Cross sections: lane and shoulder widths, side slopes, clear zone
- Pavement design: ESALs, subgrade support, layer thicknesses (flexible and rigid)
- Intersection design, roundabouts, turn lanes and capacity
- Traffic signals: warrants, phasing, cycle length, timing (MUTCD/HCM)
- Roadway drainage and safety: crash analysis, barriers, clear zone
End-of-term milestones
- Tuesday, November 17, 2026 — Poster printed and ready. 36 in × 48 in poster finalized and printed one week before the November 24 showcase.
- Wednesday, November 18, 2026 — Final document package uploaded for scoring. Chapters 4–5, calculation package, drawings and appendices uploaded in the app for advisor scoring.
- Wednesday, November 18, 2026 — Poster presentation to faculty and industry. Wednesday poster session — printed 36 in × 48 in poster presented in person; industry reviewers score communication and impact.
- Wednesday, November 25, 2026 — Oral presentation and defense (scored). Scored oral presentation and defense held on Wednesday, November 25.
Parking and Multimodal Design
Size and lay out parking facilities and multimodal transfer points.
Section B
Engineering story
A real project situation that frames this module
Week 6: parking and multimodal design is the item standing between the team and a reviewable roadway geometry, control plan and operational analysis. Size and lay out parking facilities and multimodal transfer points. Review stalls on a single line: the team cannot show the record behind parking demand estimation (ITE Parking Generation rates).
Under-providing ADA-accessible stalls relative to the total count required by code. Because stall dimensions, aisle width, and ADA-accessible stall requirements, the error does not stay local: it is carried into the design of record that drawings, quantities and cost are generated from, and every downstream product inherits it before anyone notices.
Drivers, pedestrians, cyclists, transit riders and the agency that owns the facility carry the consequence. On this module specifically, the exposure runs through circulation design for entering/exiting traffic and sight distance at driveways, and the cost of correction rises every week the roadway geometry, control plan and operational analysis moves closer to issue.
Decisions the engineer must make
- What record establishes parking demand estimation (ITE Parking Generation rates), and is that record in the project data inventory?
- Does ITE Parking Generation (5th Ed.), N/A, govern here — and is that the edition adopted by the jurisdiction?
- What is the acceptance criterion for stall dimensions, aisle width, and ADA-accessible stall requirements, and was it written before the result was known?
- Is the documented procedure valid for the conditions this project actually presents?
- If the check fails, does the team revise the roadway geometry, control plan and operational analysis or raise a change request against the locked baseline?
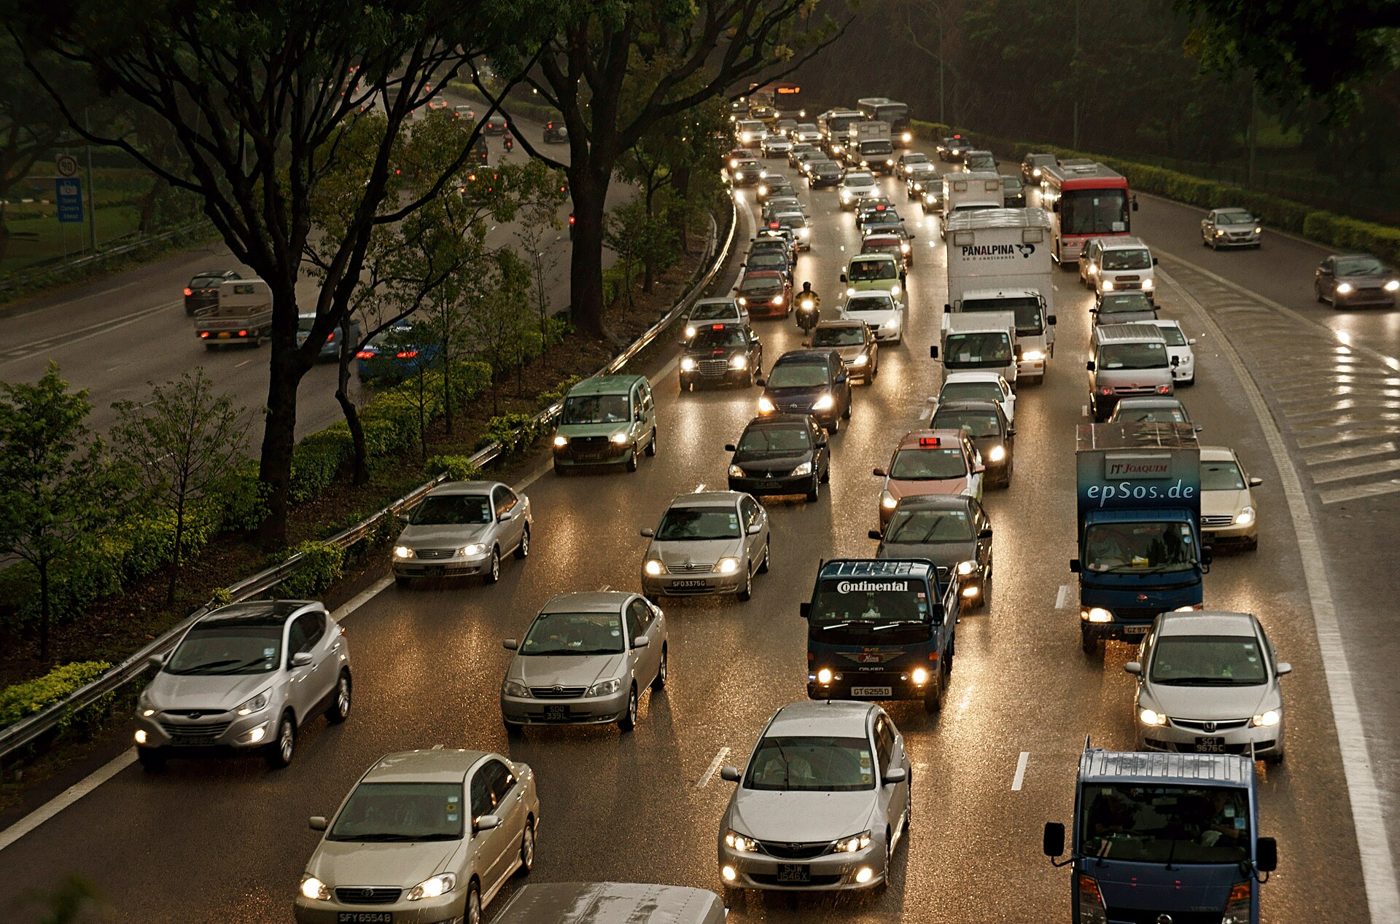
Photo 1. Peak-hour demand: the flow rate that drives capacity, delay and level-of-service analysis.
Wikimedia Commons, CC BY 2.0
Section C
Why this matters
Professional
A licensed engineer defending parking and multimodal design cites ITE Parking Generation (5th Ed.), N/A, and shows the record behind each input. Your parking layout with demand analysis and ada-accessible stall count. is reviewed the same way — traceability is assessed before arithmetic.
Technical
Parking demand estimation (ITE Parking Generation rates) controls the numbers this module hands forward. Stall dimensions, aisle width, and ADA-accessible stall requirements determines whether those numbers remain valid once conditions change.
Safety
The failure mode this module guards against is a geometric or control element that puts drivers in a conflict they cannot resolve. It reaches people through transit facility integration (park-and-ride, bus bays), which is why the safety check is recorded explicitly here rather than inferred from a passing strength or performance check.
Economic
The design of record that drawings, quantities and cost are generated from is priced from this work. Quantities, unit costs and schedule float all trace to parking demand estimation (ITE Parking Generation rates); a late correction here is paid for as a change order, not a redline.
Environmental
Environmentally, this module fixes vehicle delay emissions, pavement material demand and stormwater from added impervious area. Choosing conservatively without justification is not free — the excess shows up as material, energy and land that the project consumes for no measurable gain.
Community
Everyone who walks, rides or drives the corridor every day inherit whatever this module decides — performance, accessibility, cost of ownership and resilience are set here, not at the ribbon-cutting.
Section D
Learning objectives
By the end of this module you will be able to:
- 1.Evaluate parking demand estimation (ITE Parking Generation rates), using this project's own conditions rather than a textbook case.
- 2.Interpret stall dimensions, aisle width, and ADA-accessible stall requirements, using this project's own conditions rather than a textbook case.
- 3.Apply circulation design for entering/exiting traffic and sight distance at driveways, using this project's own conditions rather than a textbook case.
- 4.Compare transit facility integration (park-and-ride, bus bays), using this project's own conditions rather than a textbook case.
- 5.Apply ITE Parking Generation (5th Ed.), N/A, and cite the section that governs your acceptance decision.
- 6.Produce parking layout with demand analysis and ada-accessible stall count. at a standard the DOT design reviewer would accept without a second revision cycle.
Section E
Instructional content
Full lecture notes with figures and governing equations
Reading parking and multimodal design as a practising engineer
Size and lay out parking facilities and multimodal transfer points. That single sentence hides the substance of the module: parking demand estimation (ITE Parking Generation rates), and stall dimensions, aisle width, and ADA-accessible stall requirements. Both must be established from project evidence before anything downstream is credible.
In transportation engineering, this work is the input to the roadway geometry, control plan and operational analysis. Circulation design for entering/exiting traffic and sight distance at driveways — which is why this page asks you to record the source of every quantity, not just its value. The design of record that drawings, quantities and cost are generated from depends on it.
- Parking demand estimation (ITE Parking Generation rates)
- Stall dimensions, aisle width, and ADA-accessible stall requirements
- Circulation design for entering/exiting traffic and sight distance at driveways
- Transit facility integration (park-and-ride, bus bays)
Photo 1. Reading parking and multimodal design as a practising engineer in practice — Peak-hour demand: the flow rate that drives capacity, delay and level-of-service analysis.
Wikimedia Commons, CC BY 2.0
Decision logic: the procedure that replaces a closed-form solution
Parking and Multimodal Design is governed by a documented procedure rather than a single expression, so the decision logic is the deliverable: what you accept, what you reject, and on what evidence. Parking demand estimation (ITE Parking Generation rates).
Write the acceptance criterion before you look at the result. Stall dimensions, aisle width, and ADA-accessible stall requirements — recording the criterion afterwards lets it be shaped to fit the number you happened to get.
Photo 2. Decision logic: the procedure that replaces a closed-form solution in practice — Peak-hour demand: the flow rate that drives capacity, delay and level-of-service analysis.
Wikimedia Commons, CC BY 2.0
Constraints, adopted standards and the safety case for parking and multimodal design
ITE Parking Generation (5th Ed.), N/A, governs this module: Parking demand rates by land use AASHTO Green Book (7th Ed.), Ch. 9, adds the second constraint: Driveway sight distance
The safety case is explicit here. The failure mode is a geometric or control element that puts drivers in a conflict they cannot resolve; the people exposed are drivers, pedestrians, cyclists, transit riders and the agency that owns the facility; the control that prevents it is transit facility integration (park-and-ride, bus bays) together with an independent check by someone who did not perform the work.
- Controlling criterion for this module: parking demand estimation (ITE Parking Generation rates).
- Adopted reference: ITE Parking Generation (5th Ed.) — cite N/A by number.
- Failure mode guarded: a geometric or control element that puts drivers in a conflict they cannot resolve.
- Evidence produced: Parking layout with demand analysis and ADA-accessible stall count..
Photo 3. Constraints, adopted standards and the safety case for parking and multimodal design in practice — Peak-hour demand: the flow rate that drives capacity, delay and level-of-service analysis.
Wikimedia Commons, CC BY 2.0
Where this method stops being valid
Every method has a domain of validity. State the range of geometry, loading, material behaviour or flow regime over which your approach holds, and state what you would do instead beyond it.
For this project, the boundary you are most likely to push is transit facility integration (park-and-ride, bus bays). If you cross it, say so in writing, bound the error, and carry the limitation into your results chapter. A disclosed limitation is professional practice; a silent extrapolation is not.
Photo 4. Where this method stops being valid in practice — Peak-hour demand: the flow rate that drives capacity, delay and level-of-service analysis.
Wikimedia Commons, CC BY 2.0
Section F
Engineering workflow
Steps
- 1. Assemble the inputs this module needs — parking demand estimation (ITE Parking Generation rates); stall dimensions, aisle width, and ADA-accessible stall requirements — each with a unit and a source record.
- 2. Confirm ITE Parking Generation (5th Ed.) is the adopted edition and locate N/A.
- 3. State the assumptions and the acceptance criterion for parking demand estimation (ITE Parking Generation rates).
- 4. Execute the documented procedure, recording each judgement and the evidence behind it.
- 5. Test the result against circulation design for entering/exiting traffic and sight distance at driveways.
- 6. Audit units and run an order-of-magnitude check by hand before the number leaves your desk.
- 7. Obtain an independent check from a teammate who did not perform the work, and record their name and date.
- 8. Assemble parking layout with demand analysis and ada-accessible stall count. and submit it to the DOT design reviewer for review.
Decision points
- Is every input behind parking demand estimation (ITE Parking Generation rates) traceable? If not — stop and collect the record.
- Does the result satisfy stall dimensions, aisle width, and ADA-accessible stall requirements? If not — revise the work, never the criterion.
- Would the correction change the design of record that drawings, quantities and cost are generated from? If yes — raise a change-control request before proceeding.
- Have you ruled out the most common error on this module — under-providing ADA-accessible stalls relative to the total count required by code?
Quality checklist
- Documented: parking demand estimation (ITE Parking Generation rates)
- Documented: stall dimensions, aisle width, and ADA-accessible stall requirements
- Documented: circulation design for entering/exiting traffic and sight distance at driveways
- ITE Parking Generation N/A cited by section number
- Procedure steps recorded in order with evidence
- Acceptance criterion recorded before the result
- Independent check signed and dated
- Parking layout with demand analysis and ADA-accessible stall count. attached and named per the course convention
Section H
Interactive visualization
Parking and Multimodal Design — step-through
Advance one frame at a time. Each frame adds one engineering decision to the previous state.
Step 1 of 6
Estimate parking demand
Section I
Applicable codes and standards
ITE Parking Generation
5th Ed. · N/A
Adopted design/analysis reference governing this module.
Relevance: Parking demand rates by land use
Reference the section number and edition in your calculation package. Do not reproduce code text.
AASHTO Green Book
7th Ed. · Ch. 9
Adopted design/analysis reference governing this module.
Relevance: Driveway sight distance
Reference the section number and edition in your calculation package. Do not reproduce code text.
Section J
Worked examples
Full engineering solution format
Section K
Common mistakes and how to avoid them
- Under-providing ADA-accessible stalls relative to the total count required by code
- Designing two-way aisles narrower than required for 90-degree parking
- Ignoring driveway sight distance in the parking layout
- Treating parking demand estimation (ITE Parking Generation rates) as a given instead of establishing it from a project record.
- Producing parking layout with demand analysis and ada-accessible stall count. without showing how stall dimensions, aisle width, and ADA-accessible stall requirements was satisfied.
- Recording the outcome of this module without recording the judgement and evidence that produced it.
- Missing transit facility integration (park-and-ride, bus bays), which is exactly the path to a geometric or control element that puts drivers in a conflict they cannot resolve.
- Designing to the average condition when the governing condition is the controlling one.
- Freezing a design before the constructability and access review that would have changed it.
- Ignoring constructability: a design that cannot be built safely is not a completed design.
- Omitting the safety check because the strength check passed.
- Referencing figures, tables, or sources that never appear in the reference list.
Section L
Industry case study
Documented failure related to parking and multimodal design
A constructed civil works project where this module's decision was made incorrectly or skipped.
Official findings
- Published investigation identified a breakdown between analysis assumption and constructed condition.
Field observations
- The controlling assumption was documented nowhere in the design record.
- No independent check existed at the stage where the error entered the work.
Engineering interpretation
- Interpretation below is student analysis for instructional purposes, not an official finding.
- Map the failure to a step in your own workflow and state where your process would have caught it.
Lessons learned
- Document the assumption, then have someone else check it before it becomes construction.
Source: Summarize the published investigation; cite it in your reference list. Do not reproduce copyrighted report text.
Section M
FE Civil exam connection
Handbook FE Reference Handbook — transportation engineering section (record the section number from your handbook edition).
Exam topics
Handbook formulas
Weak results here feed your FE Civil Academy weak-area queue for targeted practice.
Question 1 of 2
Score: 0/2In parking and multimodal design, which item must be established BEFORE the analysis is run?
Section N
Apply it to your project — Parking and Multimodal Design
Complete this using your own capstone project data. Every field is saved to your project record and routed to your advisor with this module's submission.
Inputs and sources
Every value needs a traceable source.
| Quantity | Value | Unit | Source / record |
|---|
Assumptions and consequences
| Assumption | Basis | Consequence if wrong |
|---|
Self-check before submission
Section O
Design challenge
Consulting challenge — Parking and Multimodal Design
Your firm has been retained to deliver the parking and multimodal design scope for a municipal client on a compressed schedule. Produce the technical position your firm would defend at a public meeting.
Client request: The client wants a defensible recommendation, the basis of design, and an honest statement of what remains unresolved.
Constraints
- Adopted local code edition governs; no exceptions without written variance.
- Budget and schedule are fixed; scope changes require change control.
- Public safety and accessibility requirements are non-negotiable.
Deliverables
- One-page basis of design
- Supporting calculation extract
- Risk and limitation statement
Evaluation
- Technical correctness
- Standard compliance
- Clarity of engineering judgment
- Honest treatment of uncertainty
Section P
Documentation workspace
Write the report section for this module in the academic editor
Section Q
File uploads
Accepted: PDF, DOCX, XLSX, CSV, PNG, JPG, ZIP, DWG, DXF
No files uploaded yet.
Section R
Deliverable and advisor review
Parking layout with demand analysis and ADA-accessible stall count.
Submissions route to your assigned faculty advisor and are scored independently by faculty and administrator rubrics.
Reflection
What was the hardest engineering judgment in this module, and how did you resolve it?
Section S
ABET outcome mapping
Parking layout with demand analysis and ADA-accessible stall count. with advisor review and dual scoring.
Assessment: Faculty rubric score and administrator rubric score on this module's submission.
Rubric: Engineering design · Target: 70% of students at or above 'meets expectations'.
Parking layout with demand analysis and ADA-accessible stall count. with advisor review and dual scoring.
Assessment: Faculty rubric score and administrator rubric score on this module's submission.
Rubric: Engineering design · Target: 70% of students at or above 'meets expectations'.
Section T
References and further study
ITE Parking Generation (5th Ed.)
Adopted reference — cite section numbers, do not reproduce text.
AASHTO Green Book (7th Ed.)
Adopted reference — cite section numbers, do not reproduce text.
Parking and Multimodal Design — instructor design procedure
Course template for the calculation package format expected in the final report appendix.
NCEES FE Reference Handbook
Locate the equations used here and note the handbook section for exam recall.
Advisor meeting agenda item
Bring the unresolved decision from this module to your next weekly advisor meeting.